matplotlib.pyplot模块提供了一个 subplots() 函数,它的使用方法和 subplot() 函数类似。其不同之处在于,subplots() 既创建了一个包含子图区域的画布,又创建了一个 figure 图形对象,而 subplot() 只是创建一个包含子图区域的画布。fig , ax = plt.subplots(nrows, ncols)
nrows 与 ncols 表示两个整数参数,它们指定子图所占的行数、列数。
import matplotlib.pyplot as plt
fig,a =  plt.subplots(2,2)
import numpy as np
x = np.arange(1,5)
#绘制平方函数
a[0][0].plot(x,x*x)
a[0][0].set_title('square')
#绘制平方根图像
a[0][1].plot(x,np.sqrt(x))
a[0][1].set_title('square root')
#绘制指数函数
a[1][0].plot(x,np.exp(x))
a[1][0].set_title('exp')
#绘制对数函数
a[1][1].plot(x,np.log10(x))
a[1][1].set_title('log')
plt.show()
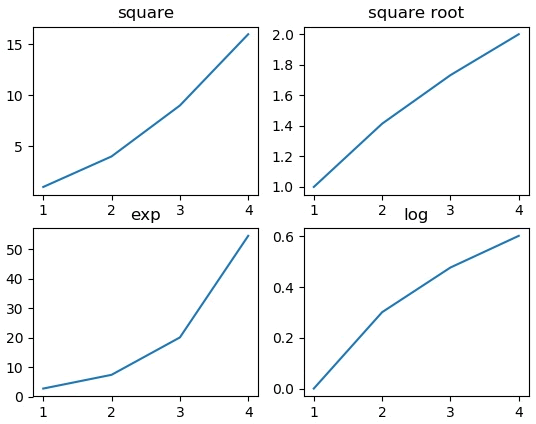
上述代码的输出结果如下:

图1:输出结果
本文链接:http://task.lmcjl.com/news/16039.html