目录
https://github.com/GreedyAIAcademy/Machine-Learning
(历史数据,结果) -> 算法模型
(未来数据) + 算法模型 -> 预测结果
推荐书目:机器学习实战
监督学习:输入数据有标签,即训练数据包含输入和预期的输出
非监督学习:输入数据没标签,即训练数据只有输入, 没有预期的输出

One-Hot encoding:参考:https://www.cnblogs.com/bugutian/p/11101522.html
MultiGram: 类似默克尔树的学习方法
Bag of words:字典数的学习方法
import pandas as pd
import numpy as np
import matplotlib.pyplot as plt
from sklearn.linear_model import LinearRegression

data = pd.read_csv("height.vs.temperature.csv")
#查看列标题
data.columns

#数据可视化
plt.figure(figsize=(16,8))
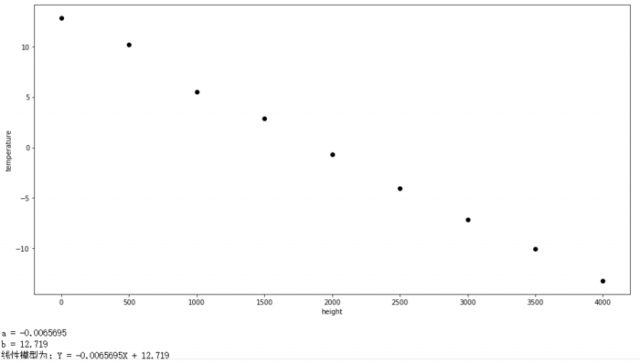
plt.scatter(data['height'],data['temperature'],c='black')
plt.xlabel("height")
plt.ylabel("temperature")
plt.show()

#训练线性回归模型
x = data['height'].values.reshape(-1,1)
y = data['temperature'].values.reshape(-1,1)

reg = LinearRegression()
reg.fit(x,y)

#打印结果
print('a = {:.5}'.format(reg.coef_[0][0]))
print('b = {:.5}'.format(reg.intercept_[0]))

print("线性模型为:Y = {:.5}X + {:.5} ".format(reg.coef_[0][0], reg.intercept_[0]))

#画出预测曲线
predictions = reg.predict(x)
plt.figure(figsize=(16, 8))
plt.scatter(data['height'], data['temperature'], c = 'black')
plt.plot(data['height'], predictions, c = 'blue', linewidth=2)
plt.xlabel("height")
plt.ylabel("temperature")
plt.show()

#预测结果
predictions = reg.predict([[230]])
print('当高度分别为230和2300米时,温度分别为为{:.5}摄氏度'.format( predictions[0][0] ))
结果:
物体转化成向量:见数据预处理
打标签:人工打(不再机器学习的步骤中)
算举例:欧式距离
选择合适的K: 看决策边界
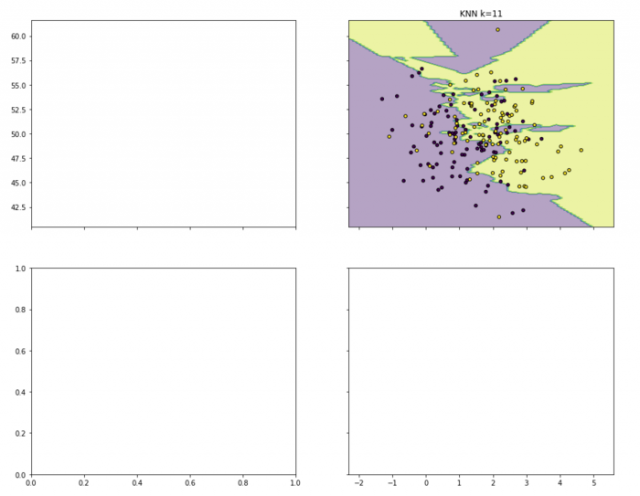
将二维矩阵中所有的点都预测出来之后,决策边界就显现出来了
课堂测试结果:K值越大,决策边界越平滑越稳定

Mahalanobis Distance
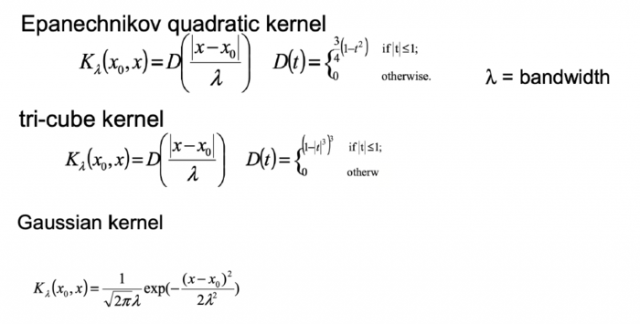
加权
将低维空间不可分数据映射到高纬度的空间

学习过程中,机器学习的基本概念相对较简单,主要是实现过程中,对图形处理方面知识的欠缺,反而是一个大问题。因此将机器学习中KNN决策边界问题的代码进行简化来阐述可视化和矩阵操作相关的知识。代码和注释如下:
#y是一个一维数组[0,0,0...,1,1,1...]
y = np.array([0]*n_points + [1]*n_points)
#结果是(200,2)和(200,),因为是两个n_points数组拼接而成的
print (X.shape, y.shape)

# KNN模型的训练过程
lf = KNeighborsClassifier(n_neighbors=11).fit(X,y)

# 可视化结果
x_min, x_max = X[:, 0].min() - 1, X[:, 0].max() + 1
y_min, y_max = X[:, 1].min() - 1, X[:, 1].max() + 1
xx, yy = np.meshgrid(np.arange(x_min, x_max, 0.1),
                     np.arange(y_min, y_max, 0.1))

#当前的结果xx、yy各自是一个(164, 74)方阵
# print(xx.shape, yy.shape)

#表示画2X2的四张子图
f, axarr = plt.subplots(2,2, sharex='col', sharey='row', figsize=(15, 12))

# nparray.ravel()返回的是展平后的一维数组
# np.c_的结果np.c_[[0,1],[4,5]]=[[0,4],[1,5]]
# 意思是,164X74方格内的所有点都预测一遍,结果写在Z中
Z = lf.predict(np.c_[xx.ravel(), yy.ravel()])

# Z是一维数组
# print (type(Z),Z.shape)
# 把Z按xx(164, 74)转换成方阵
# 这样Z中的每个预测值都对应一个点
Z = Z.reshape(xx.shape)

# alpha混合值,介于0(透明)和1(不透明)之间
# axarr[0, 1]表示画在2X2的图形组成的矩阵中,右上角的位置
# 如X=[[x1,y1][x2,y2]...],X[:, 0]表示[x1,x2...],同理,X[:, 1]表示[y1,y2...]
# c=y中,y是上文中的标签数组,KNN模型由(X,y)训练而成,相对应的点会根据y值的不同而着不同的色
# edgecolor='k'就是图中每个圆点的边缘的颜色
axarr[0, 1].contourf(xx, yy, Z, alpha=0.4)
axarr[0, 1].scatter(X[:, 0], X[:, 1], c=y,
                                  s=20, edgecolor='k')
axarr[0, 1].set_title('KNN k=11')
plt.show()
结果:
本文链接:http://task.lmcjl.com/news/5775.html