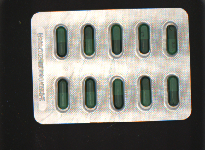
一、目标
1 将药板从黑色背景中分离(药板部分显示为白色,背景显示为黑色);
2 根据分割结果将药板旋转至水平;
3 提取药板中的药丸的位置信息;
二、方法描述
处理图像如下:

(1)首先将图像转为灰度图像,并做二值化处理,并采用闭运算将胶囊边缘平滑处理。得到图像如下所示:
(2)利用imfill填充命令将胶囊填充,得到下图:
分别从图像中点左右各距100像素点位置向下遍历像素点,直到遍历到白色边缘即胶囊板的边缘停止,分别记录像素点的坐标,示意图如下:
由此计算胶囊板的倾斜角度θ=arctan(|X2-X1|/| Y2-Y1|),利用imrotate命令将图像旋转至水平。处理后图像如下图所示:
(3)将分别旋转水平的填充图像减去未填充图像得到下图:
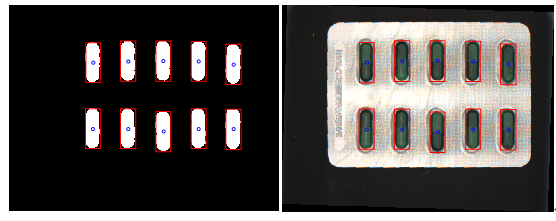
利用regionprops命令分别得到图像各个区域中像素总个数,包含相应区域的最小矩形,每个区域的质心(重心)。标记得到每个胶囊的位置信息和标记位置信息。处理以及原图上的标记如下所示:

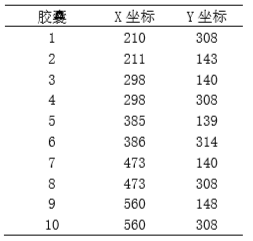
胶囊的质心位置信息如下表所示:

三、程序代码
clc;
I=imread('C:UserskkzhangDesktop1xl-130-16.tiff');
a=rgb2gray(I);
figure(1)
imshow(I);
figure(2)
imshow(a);
x=size(a,1);
y=size(a,2);
g=zeros(x,y);
for i=1:1:x
    for j=1:1:y
    if(a(i,j)<120)
       g(i,j)=0 ;
    else
      g(i,j)=255;
    end
    end
end

%imshow(g);
fillg=zeros(x,y);
fillg=imfill(g,'holes');
%将胶囊的边缘平滑整齐
se=strel('square',5);
closeg=imclose(g,se);
figure(3)
imshow(closeg);
title('闭运算后')

BW=edge(fillg,'roberts');
figure(5)
imshow(BW);
tiqu1=y/2-100;
tiqu2=y/2+100;
cishu1=0;
cishu2=0;
for i=1:1:x
    if(cishu1==0)
        if(g(i,tiqu1)==255)
            x1=i;
            cishu1=1;
        end
    end
end
for i=1:1:x
    if(cishu2==0)
        if(g(i,tiqu2)==255)
            x2=i;
            cishu2=1;
        end
    end
end
theta=atan(abs(x1-x2)/abs(tiqu2-tiqu1))*180/pi;
S = imrotate(BW,-theta);
A= imrotate(closeg,-theta);
B= imrotate(fillg,-theta);
I= imrotate(I,-theta);
BW=imrotate(BW,-theta);
C=B-A;
figure(6)
imshow(C);

%标签定位
fill_write=B;
figure(4)
imshow(B);
start1=0;
start2=0;
for i=1:1:y
    if(start1==0)
        if(BW(i,y/2)==1)
            sta_y=i;
            start1=1;
        end
    end
end
for i=1:1:x
    if(start2==0)
        if(BW(i,x/2)==1)
            sta_x1=i;
            start2=1;
            i=i+20;
        end
    end
    if(start2==1)
        if(BW(i,x/2)==1)
            sta_x2=i;
            start2=2;
        end
    end
end
sta_x=sta_x2-sta_x1;
for j=(sta_y+round(sta_x/3)):1:y
   for i=1:1:x
    fill_write(i,j)=0;
   end
end
imshow(fill_write);
img = regionprops(fill_write,'boundingbox');
locate = cat(1,img.BoundingBox);

T = graythresh(C);
bw_img = im2bw(C, T);
img_reg = regionprops(bw_img,'area', 'boundingbox','Centroid');
areas = [img_reg.Area];
rects = cat(1,img_reg.BoundingBox);
zhixin = cat(1,img_reg.Centroid);
figure(7);
imshow(I);
for i = 1:size(rects, 1)
    rectangle('position', rects(i, :), 'EdgeColor', 'r');
        hold on
    plot(zhixin(i,1),zhixin(i,2),'ob');
    hold on
end
for i = 1:size(locate, 1)
    rectangle('position', locate(i, :), 'EdgeColor', 'r');
        hold on
end
Don't wait for the perfect moment,take the moment and make it perfect!
转载需说明出处,笔者总结之前的知识,与大家分享,有问题的可以留给我哦~
本文链接:http://task.lmcjl.com/news/12535.html